
By American Immigration Council
There are more than 23 million female immigrants in the United States today, and they are a formidable presence in U.S. society and the economy. Female immigrants come from every corner of the globe and outnumber male immigrants. They are more likely than male immigrants to come to the United States through the family-based immigration system and over half are naturalized U.S. citizens. Nearly a third of immigrant women age 25 and older have a bachelor’s degree or more education. Out of the top 10 source countries of female immigrants, women from India are the most highly educated, followed by those from the Philippines and Korea.
Immigrant women account for nearly 16 percent of all employed women age 16 and older in the United States. In fact, women from the Philippines, El Salvador, Vietnam, the Dominican Republic, and Colombia have higher rates of participation in the labor force than U.S.-born women. Immigrant women work in every occupation, with over one-third in management, business, science, and arts occupations, while nearly a third work in service occupations and under a quarter in sales and office occupations. Despite their hard work and educational achievements, immigrant women earn less than foreign-born men, and less than native-born men or women. Given their numbers and diversity, however, the scale of their economic contributions cannot be denied.
Mexico Is the Single Largest Country of Origin for Immigrant Women and Girls
- Mexico accounted for almost one-quarter (23.3 percent) of all female immigrants in 2018, followed by India at 5.4 percent, China at 5.3 percent, and the Philippines at 5.2 percent {Table 1}.
- In a sign of their diverse range of national origins, more than two-fifths (or 44.2 percent) of female immigrants came from countries other than the top 10 {Table 1}.
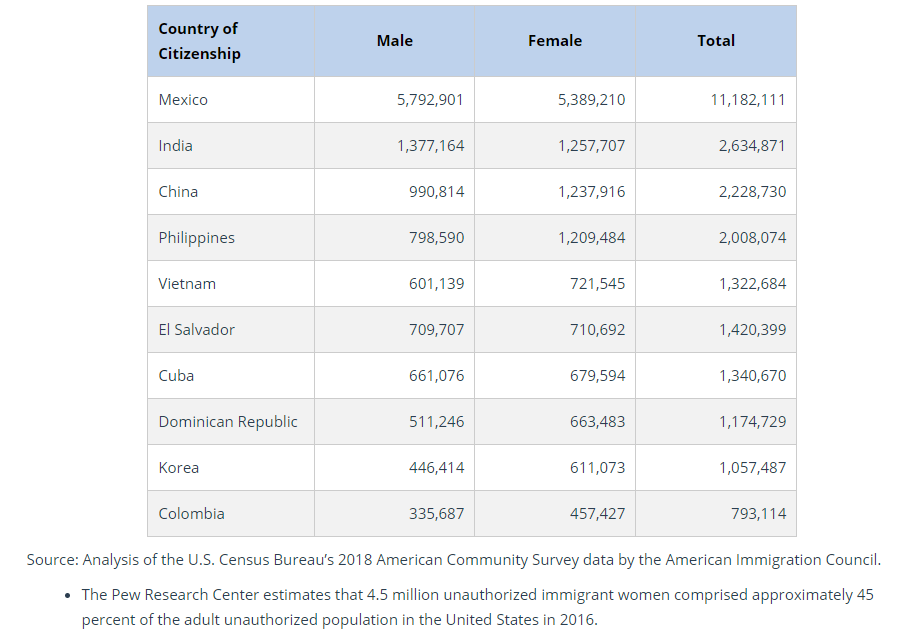
Table 1: Female Foreign-Born Population by Country of Origin, 2018

Immigrant Women and Girls Outnumber Immigrant Men and Boys
- There were 23.2 million female immigrants in the United States in 2018, accounting for more than half (51.8 percent) of the total foreign-born population. Similarly, women and girls accounted for more than half (50.6 percent) of the native-born population.
- Immigrants accounted for 14 percent of the female population.
- Male immigrants outnumbered female immigrants among immigrants from Mexico and India {Table 2}.
- Among immigrants from China, the Philippines, Vietnam, the Dominican Republic, Cuba, El Salvador, Colombia, and Korea, female immigrants outnumbered male immigrants {Table 2}.
Table 2: Foreign-Born Population by Gender & Select Countries of Origin, 2018
Immigrant Women and Girls are More Likely Than Immigrant Men and Boys to Come to the United States Through the Family-Based Immigration System
- Data from the Department of Homeland Security (DHS) indicate that female immigrants are more likely than male immigrants to come to the United States through the family-based class of admissions, rather than through employment {Figure 1}.
- 114,550 female immigrants obtained legal permanent resident (LPR) status under family-based “preference” categories in Fiscal Year (FY) 2018, compared to 102,012 male immigrants. Likewise, 277,901 female immigrants obtained LPR status because they were an immediate relative of a U.S. citizen, compared to only 201,058 male immigrants.
- In contrast, 70,921men obtained LPR status under employment-based categories, compared to 67,249 women.
Figure 1: Foreign-Born Women Who Obtained LPR Status by Class of Admission, FY 2018
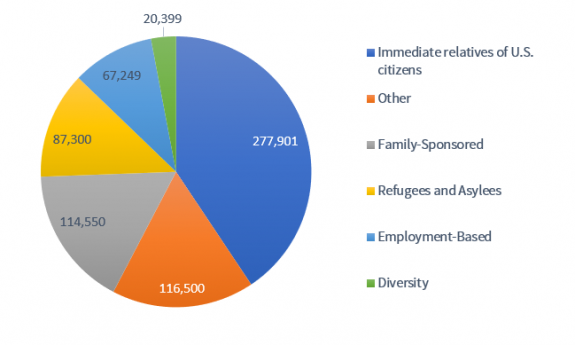
Source: Office of Immigration Statistics, U.S. Department of Homeland Security, 2018 Yearbook of Immigration Statistics, Table 9.
Immigrant Women and Girls from Vietnam and the Philippines Have Particularly High Naturalization Rates
- Over half (53.0 percent) of female immigrants were naturalized U.S. citizens in 2018, compared to 48.1 percent of male immigrants.
- More than three-fourths (77.0 percent) of female Vietnamese immigrants were naturalized U.S. citizens in 2018, as were more than two-thirds (71.0 percent) of female immigrants from the Philippines. Among female immigrants from Korea, the naturalization rate was 66.1 percent; among those from Colombia it was 63.6 percent; and for Cubans it was 63.1 percent.
- Female immigrants were more likely to be naturalized U.S. citizens than male immigrants for nine out of their top 10 countries of origin {Table 3}.
Table 3: Male and Female Naturalization Rates by Select Countries of Origin 2018

Immigrant Women from India Are the Most Highly Educated
- Almost one-third (31.7 percent) of immigrant women age 25 and older had a bachelor’s degree or more education in 2018, compared to 33.6 percent of native-born women and 32.4 percent of foreign-born men.
- The educational attainment of foreign-born women in 2018 varied widely according to country of origin.
- Among the top 10 origin countries for female immigrants, the highest percentage of immigrant women with a bachelor’s degree or more education came from India (76.3 percent), followed by the Philippines (51.6 percent), and Korea (51.1 percent). At the other end of the spectrum were Mexico and El Salvador (both at 7.9 percent), and the Dominican Republic (16.8 percent) {Table 4}.
- Immigrant women had a higher percentage of bachelor’s degrees or higher compared to their male counterparts in five out of 10 of the top origin countries for female immigrants {Table 3}.
Table 4: Share of Foreign-Born Population with a Bachelor’s Degree or Higher, by Select Countries of Origin, 2018

Source: Analysis of the U.S. Census Bureau’s 2018 American Community Survey data by the American Immigration Council.
- The share of immigrant women with a bachelor’s degree or more education increased from 27.5 percent in 2012 to 31.7 percent in 2018. The share of native-born women with a comparable level of education also increased from 29.4 percent in 2012 to 33.6 percent in 2018.
Immigrant Women Are Active in the Labor Force, with Some Origin Countries Seeing a Higher Rate of Labor Force Participation for Immigrant Women Than for Native-Born Women
- On average, 56.6 percent of foreign-born women age 16 and older were in the labor force in 2018, compared to 58.9 percent of native-born women.
- Foreign-born women make up 16 percent of employed women in the United States.
- The labor-force participation rate of immigrant women rose slightly from 56.4 percent in 2012 to 56.6 percent in 2018. By way of comparison, the labor force participation rate of native-born women fell slightly from 59.2 percent in 2012 to 58.9 percent in 2018.
Of the top 10 origin countries for foreign-born women:
- Women from five of these countries have higher rates of labor force participation than native-born women {Figure 6}: The Philippines (64.6 percent), El Salvador (62.6 percent), Colombia (62.1 percent), Vietnam (61.5 percent), and the Dominican Republic (60.7 percent), compared to native-born women (58.9 percent).
- Immigrant women from Cuba have the lowest rate of participation in the labor force among the top 10 origin countries at 52.4 percent.
- However, in absolute numbers, there are more native-born women over 16 years old in the labor force (66.0 million) than foreign-born women (12.6 million).
Figure 2: Percentage of Women in the Labor Force, 2018

Source: Analysis of the U.S. Census Bureau’s 2018 American Community Survey data by the American Immigration Council.
- Over one-third (34.8 percent) of immigrant women in the labor force worked in management, business, science, and arts occupations in 2018, while just under a third (31.2 percent) worked in service occupations, under one quarter (21.3 percent) in sales and office occupations, and 1 in 10 (10.5 percent) in production and transportation occupations {Figure 3}.
- Over two-thirds of immigrant women from India who were in the labor force in 2018 worked in management and professional occupations (68.6 percent), compared to two-fifths of native-born women (41.8 percent).
- Over half of immigrant women in the labor force from El Salvador worked in service occupations (51.0 percent), compared to one-fifth of native-born women (20.5 percent).
Figure 3: Percentage of Foreign-Born and Native-Born Women by Occupation, 2018

Source: Analysis of the U.S. Census Bureau’s 2018 American Community Survey data by the American Immigration Council.
Immigrant Women in the Labor Force Earn Less Than Any Other Demographic
- Immigrant women in the labor force had an annual median income of $27,600 in 2018, compared to $32,300 for native-born women, $38,000 for foreign-born men, and $45,000 for native-born men.
- Among the top 10 origin countries for female immigrants, immigrant women from India who were in the labor force had the highest median annual income ($56,000). Four other Asian countries followed: the Philippines ($40,000), Korea ($39,200), China ($34,000), and Vietnam ($29,000).
- Women from Mexico who were in the labor force earned the least in 2018 out of the top 10 origin countries, with an annual median income of $20,000. Four other Latin American origin countries rounded out the bottom five for annual median incomes: El Salvador ($21,000), the Dominican Republic ($22,000), Cuba ($24,000), and Colombia ($26,000).
- In all top 10 countries of origin, immigrant men in the labor force earned more than immigrant women in the labor force {Figure 4}.
Figure 4: Median Earnings of Foreign-Born Men and Women from Select Countries of Origin

Source: Analysis of the U.S. Census Bureau’s 2018 American Community Survey data by the American Immigration Council.
Immigrant Women and Girls in the United States added by Caribbean American Weekly on
View all posts by Caribbean American Weekly →